
“The biggest investing errors come not from factors that are informational or analytical, but from those that are psychological.”
— Howard Marks
Dear Investors,
FY24 has been a stupendous year for us as we clocked ~ 90% return for the year on our portfolio. At the beginning of the year when the markets were still in sombre mood and against most market predictions, we had called out in our Mar’23 Newsletter that FY24 should see significant value creation based on the business visibility that we were seeing for our portfolio companies. We are glad that our understanding of the portfolio companies has played out to perfection to end the year at such a high! We share our performance hereunder:
Our performance:
Equitree has once again emerged amongst the top 10 BEST performing PMS in India across all categories with 89.63% returns beating benchmark index by whopping 49.47%!
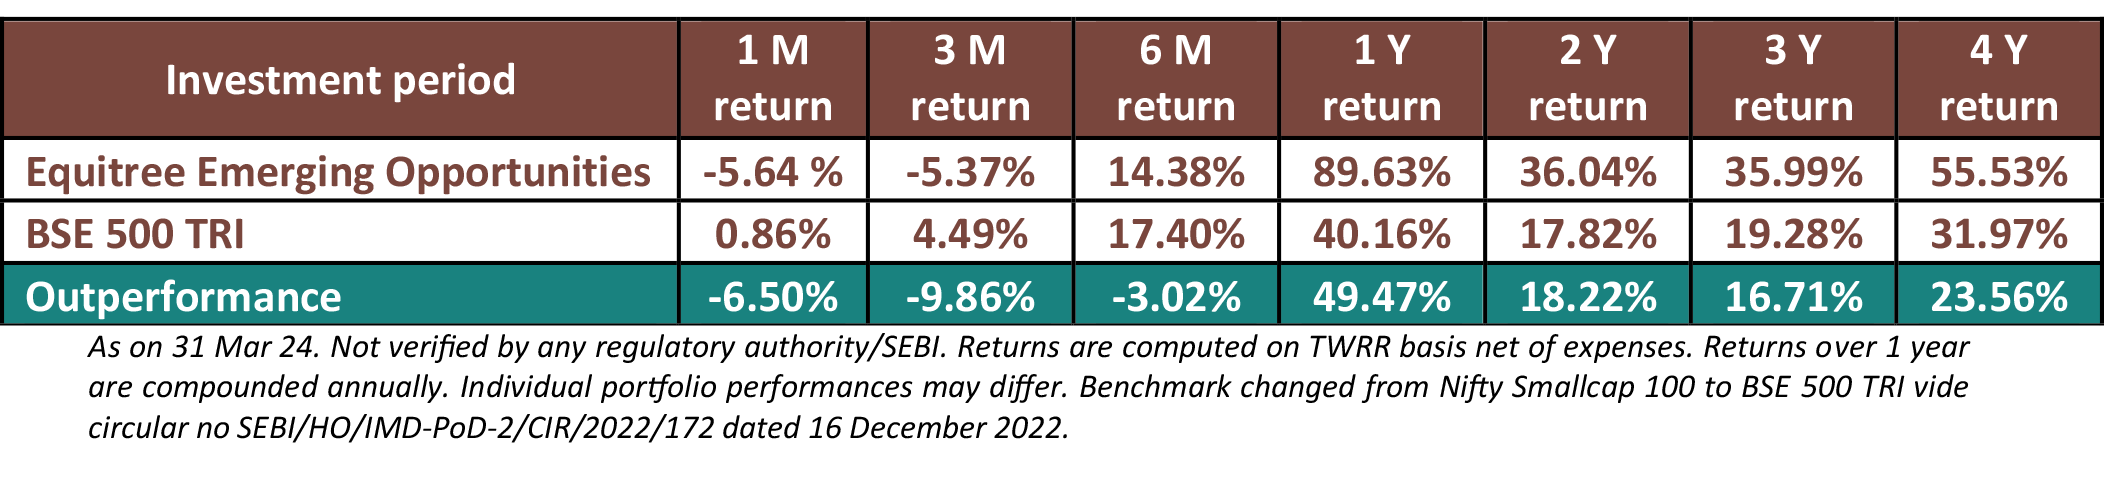
It is now the 4th year in a row that Equitree has been amongst the top 2% BEST performing PMS’s in India consistently across all strategies.
Even after this performance, the median valuation of our portfolio is 16x FY25 and is expected to see a median profit growth of 24% in FY25. This leaves significant upside still to happen in our portfolio companies!
The last quarter – more particularly last couple of months hasseen some consolidation / profit booking leading to a negative return of 5.37% during the quarter. This is in line with our expectation wherein we had mentioned in the last quarterly newsletter that we could see some draw downs given the quick pace at which the markets had gone up.
Over the past two months, we've witnessed notable volatility, with the Nifty Smallcap 100 Index declining by 15.6% from its 52-week high and the Nifty Microcap 250 Index experiencing a downturn of over 17%. This has heightened the conversations around a simmering “bubble” in the market. This further got accentuated with SEBI chief’s endorsement that there is indeed “froth” in some pockets of the market.
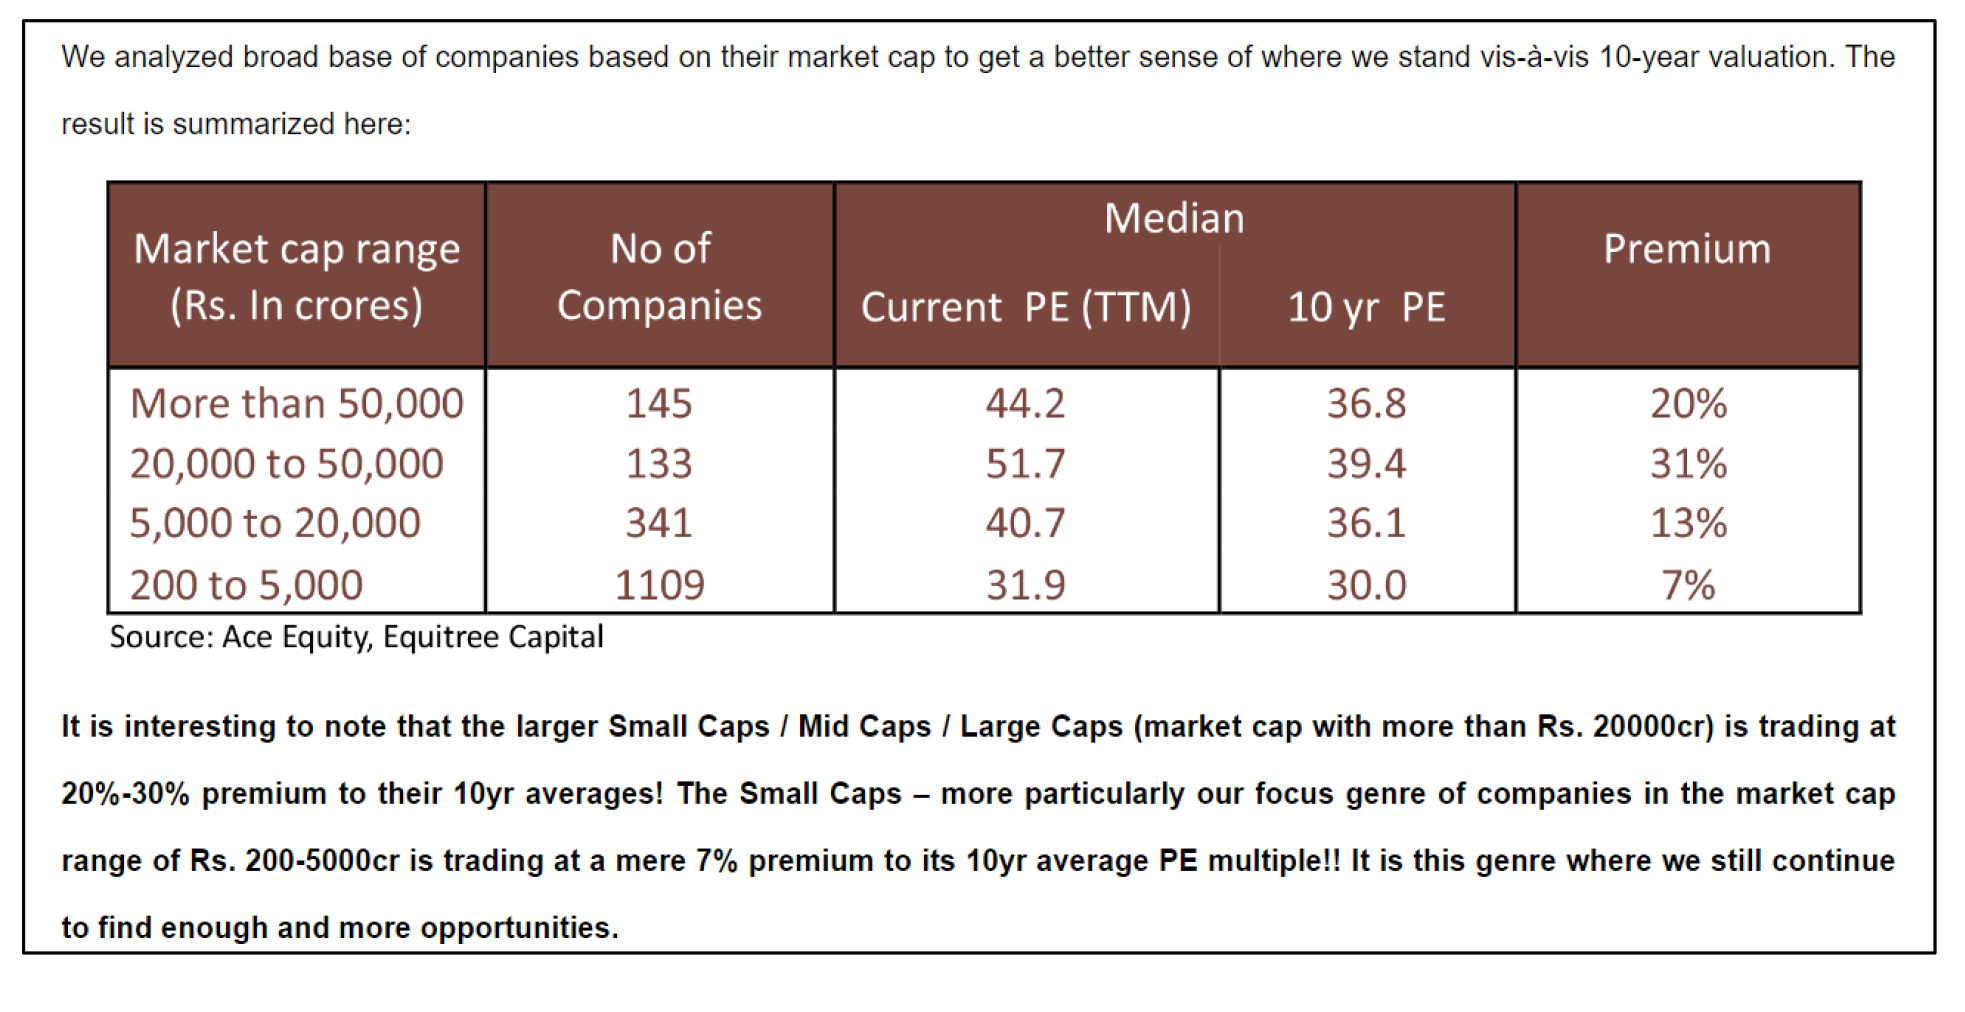
While we acknowledge that valuations in certain pockets – more particularly the SME Exchange and certain larger mid / small caps are indeed beyond comfort zones, we again reiterate that valuation in our genre of companies is still reasonable and trading at its 10yr average and has no sign of excesses. We share a quick snapshot from our Dec’23 newsletter for your ready reference hereunder:
Notwithstanding excesses of valuations in certain pockets and possibility of an eminent correction, we use this opportunity to share our thoughts why we believe this is no where near to a “bubble” phase and why one should use the correction, if any, to build portfolio of high quality businesses which eventually should lead to massive wealth creation happening over the next couple of years.
“One thing that will always play out is Stock prices are slaves to earnings in the long run.”
Where is the “BUBBLE” Honey?
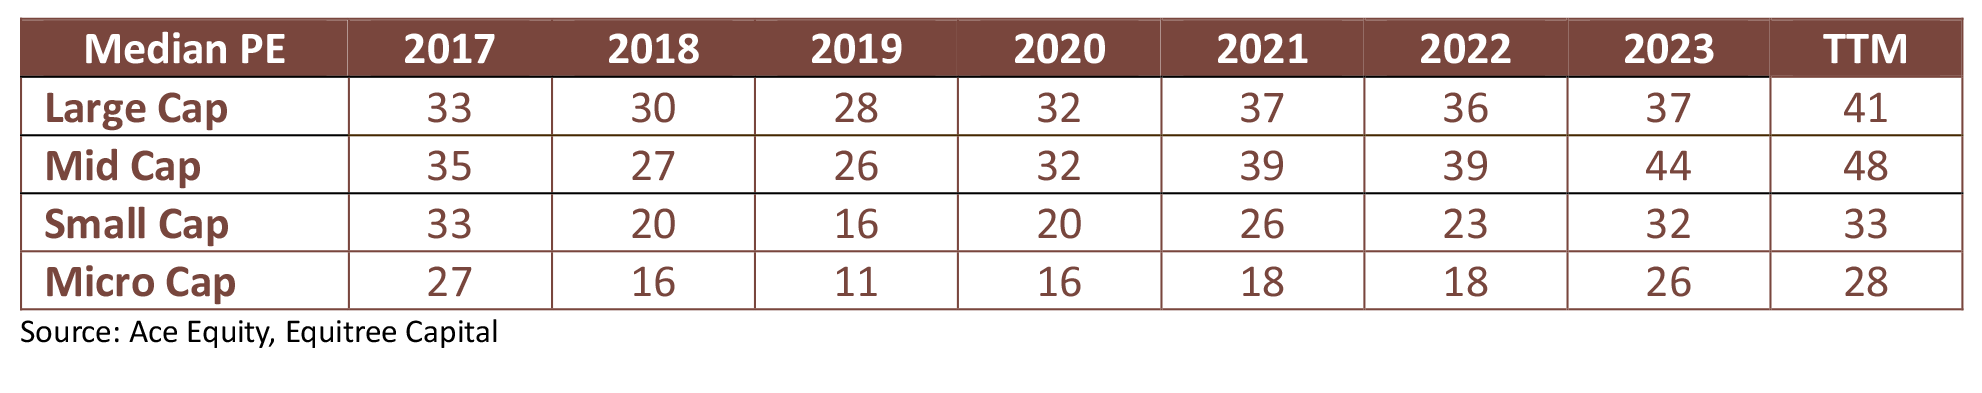
One of the key reasons for marketmen to be anxious about a “bubble” is the fact that the current absolute valuations seem to be in similar range to that of 2017 – reminiscent of the massive draw downs that followed an unprecedented run up in Small Caps in the run up to 2017:
Memories of a significant selloff in the broader markets, with indices like the Nifty Small Cap Index plunging by around 67% from Jan 2018 to March 2020 is what is making people question – will this time be really different?
We did a lot of data crunching to analyse whether this time is indeed different and share our thoughts hereunder:
-
Sharp drop in earnings post 2017 led to the sell off, not the absolute valuation.
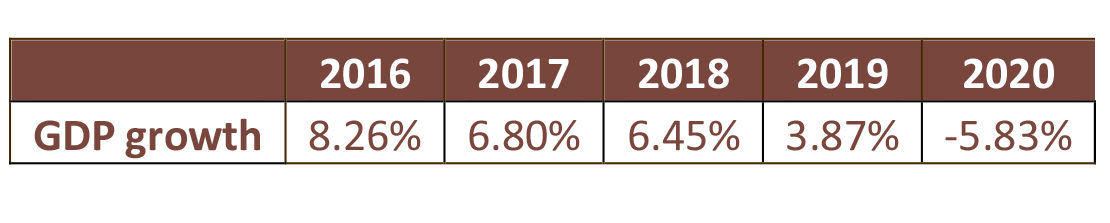
Valuations are always forward looking in anticipation of the earnings growth for companies. Coming on the back of handsome GDP growth in 2016 and 2017, the expectation was that corporate earnings will continue to grow – leading in to the absolute valuations.
However, what followed post 2017 was an unprecedented slew of regulatory changes aimed at cleaning up the economy which completely capsized the economy and resultantly massive degrowth in corporate profits as well:
-
Downward Spiral: Four Years of GDP on a Rollback Rampage:

-
In line with this, corporate profits also nosedived for the broader base of the markets – more particularly impacting the Small and Mid-sized businesses:
 It was this substantial degrowth in earnings which led to the fall in the Small and Micro Cap segment and not the absolute valuations! For ease of reference, we enumerate some of the key regulatory changes which threw businesses out of gear and led to this choking of earnings:
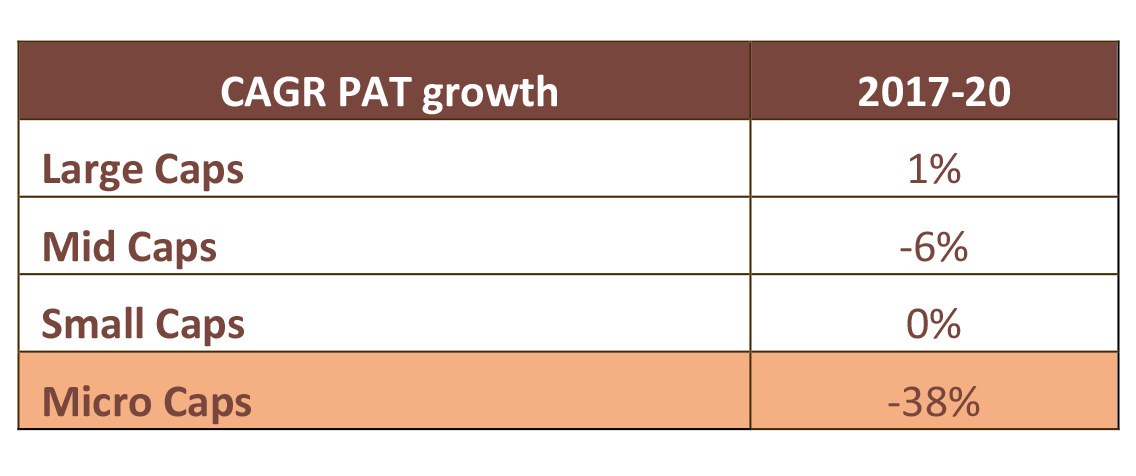
- Demonetization (2016): The sudden withdrawal of high-denomination currency notes by the Indian government aimed to curb corruption and illicit cash flows. However, it disrupted economic activity, especially in the informal sector, leading to liquidity shortages and decreased consumer spending.
- Implementation of Goods and Services Tax (GST) (2017): While GST aimed to streamline India's complex tax structure and create a unified market, its implementation faced challenges. Businesses struggled to adapt to the new tax regime, leading to disruptions in supply chains and inventory destocking, which affected GDP growth.
- Banking Sector Cleanup (2018-2019): The Indian banking sector faced a crisis of nonperforming assets (NPAs) or bad loans, leading to a cleanup effort by the government. Measures such as the Insolvency and Bankruptcy Code (IBC) were introduced to resolve NPAs. However, this process impacted credit availability and investment, affecting economic growth.
- Liquidity Crisis (2019): The Indian financial system experienced a liquidity crunch in 2019, with non-banking financial companies (NBFCs) facing funding challenges. This liquidity squeeze affected credit flow to businesses and consumers, hampering economic activity.
- COVID-19 Pandemic (2020): The outbreak of the COVID-19 pandemic in early 2020 had a profound impact on India's economy. Lockdowns and restrictions imposed to contain the spread of the virus led to disruptions in production, supply chains, and demand across sectors. The pandemic-induced economic downturn resulted in a sharp contraction in GDP growth in 2020.
-
Downward Spiral: Four Years of GDP on a Rollback Rampage:
-
Current backdrop seems poised for a buoyant corporate earnings growth – PEG of 1.25-1.50 doesn’t give any sign of a “bubble”.
Amidst all the global chaos of slowdown, inflation, interest rates, geopolitical issues et al, India today is consensually looked upon as a beacon of hope, growth and stability. Right from very strong macros to the push for emerging as a credible manufacturer to the world, Indian economy and resultantly corporate earnings seem poised for a handsome growth in the coming years. We deep dived in to hard data to get further conviction on this opportunity:
-
Capital expenditure at an all-time high:
-
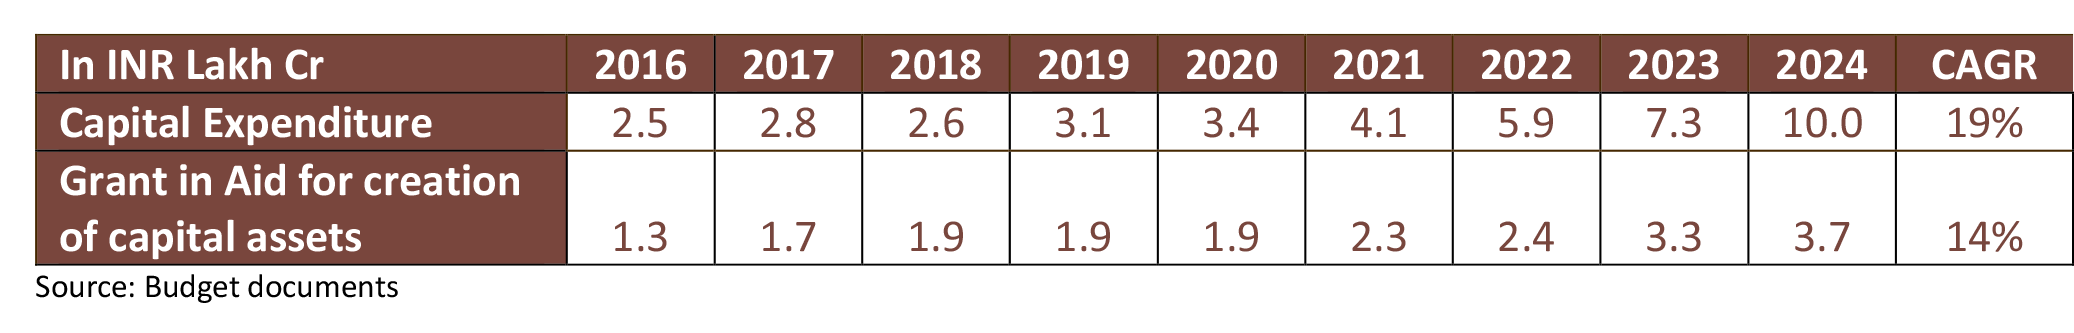
The capital expenditure has increased by four folds in the last 8 years from INR 2.5 Lakh Cr to INR 10 Lakh Cr by FY24. The government has allocated INR 11.1 lakh crore as capital expenditure for FY25 which is an increase of 10% YoY.
The government's expenditure increased at a moderate rate in FY25, since the private capex cycle is expected to take over from here. The government's continued emphasis on capital expenditures, which supports the anticipated growth in the medium term, isshown in the 19% CAGR increase.
-
Cycle turns in the Capital goods sector – the capital goods segment grew at 9% CAGR precovid. But, post covid it is expected to grow by 13-15% until FY26.
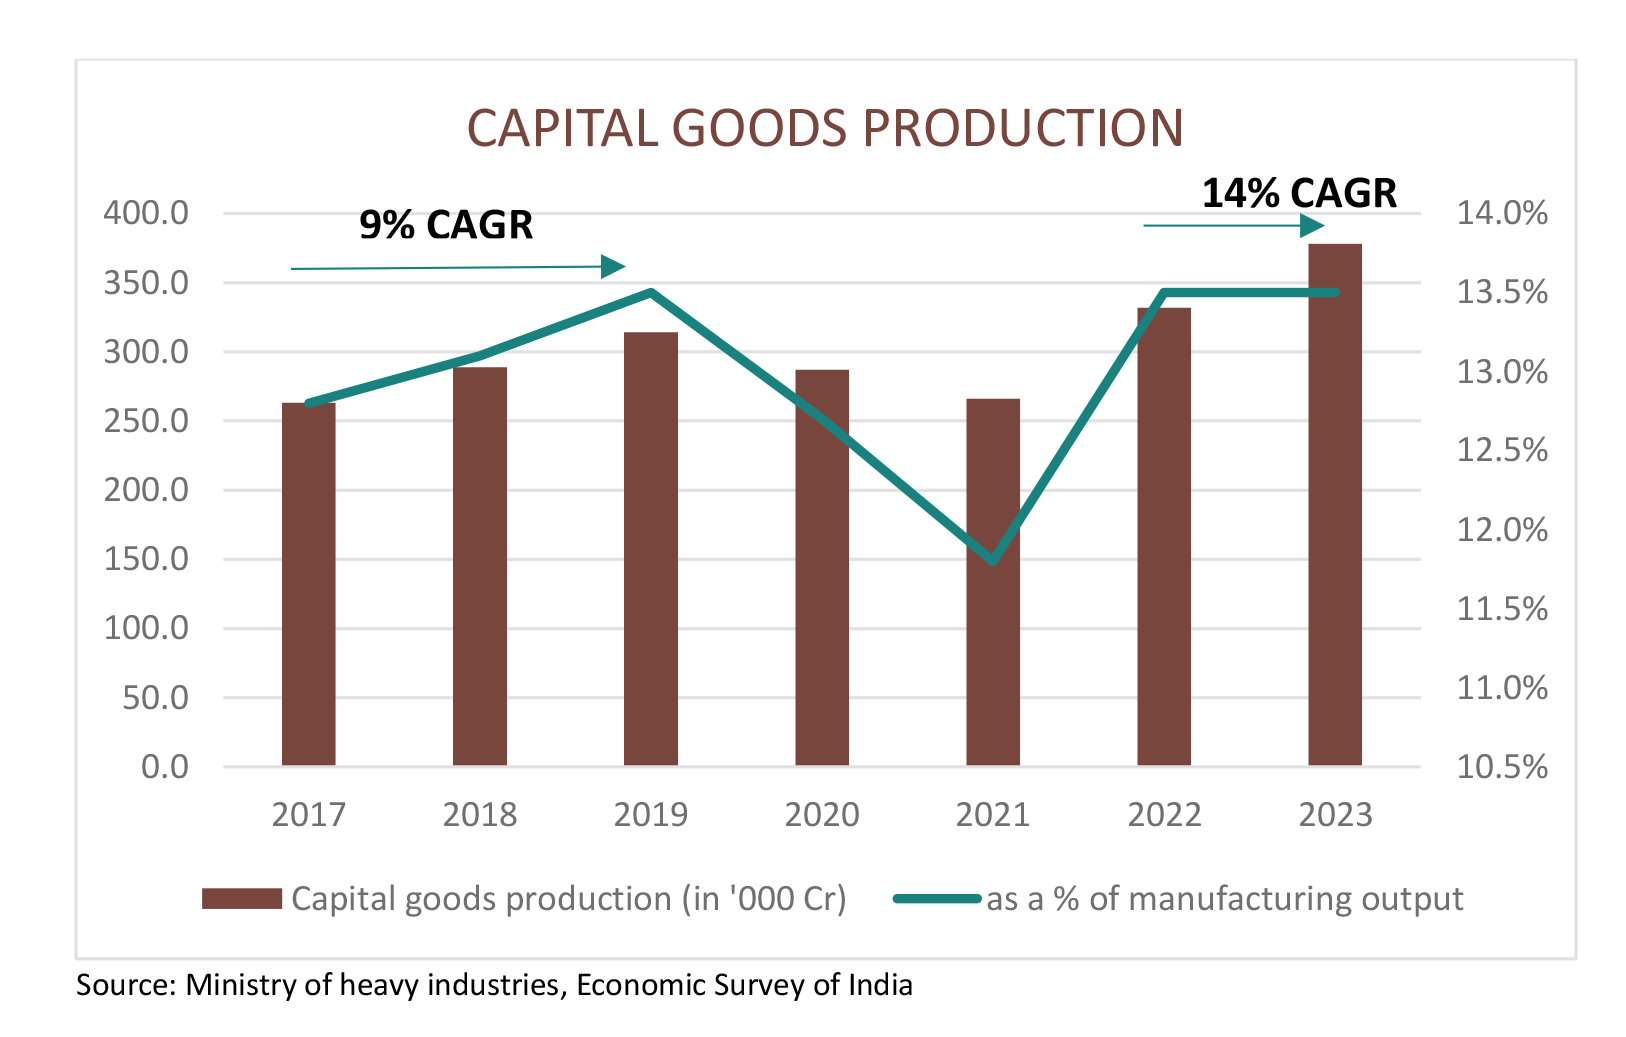
- Q1-Q2 will see fulfilment of the existing orders, post Q2 this growth will be led by continued government outlay for infrastructure, anticipated revival in the private capital expenditure, PLI led investments, EV infrastructure, data-centre related investments.
- PLI-fuelled capital expenditure is projected to reach its peak by FY26, with private investment poised to pick up the baton and maintain the growth momentum thereafter.
-
The capital expenditure has increased by four folds in the last 8 years from INR 2.5 Lakh Cr to INR 10 Lakh Cr by FY24. The government has allocated INR 11.1 lakh crore as capital expenditure for FY25 which is an increase of 10% YoY.
-
Gross Fixed Capital Formation at 35% of GDP is at highest level since 2009!
Gross fixed capital formation (GFCF) is an important facet of GDP growth as it serves as a barometer of the production of productive assets within the economy. During the last mega bull run of 2003-2007 cycle, investments grew faster than the consumption and the capex boom led to an acceleration in productivity, job creation, & Income growth. Investment to GDP rose from 27% in FY03 and it peaked at 39% in FY08. Now, the ratio has reached to 34% level and is still expected to go up from here onwards. GFCF has grown from a low of 30.7% of Gross Domestic Product (GDP) in FY15 to 35.3% of GDP in the second quarter (July – September) of the FY24. This is the highest level of asset formation in the Indian economy since 2009. As per economists, India has to maintain GFCF above 32 percent of GDP on a sustained basis to attain more growth and unleash the economic potential of India.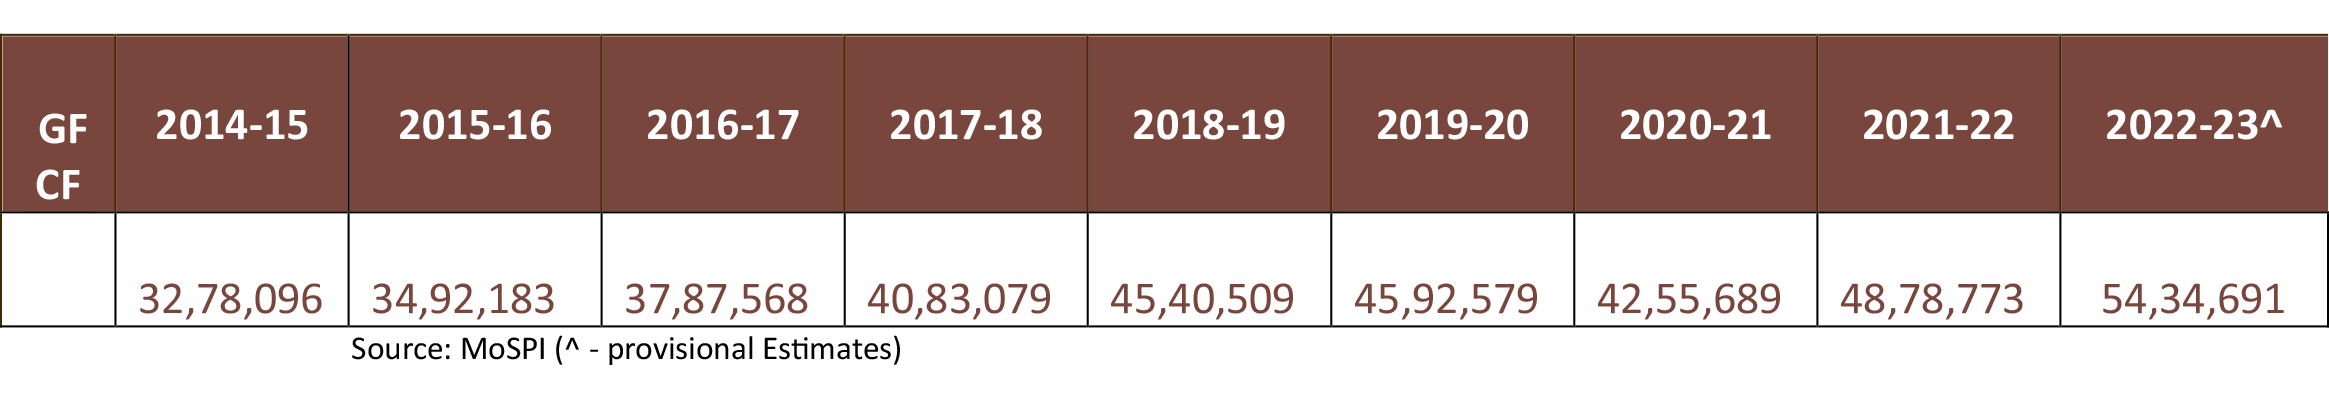
-
Corporate Profit to GDP ratio likely to go up to 8%
The listed corporate space’s PAT/GDP growth ratio rose to 4.7% on a trailing twelve months and is on course to exceed 5% by FY25 as per ICICI securities.As per Morgan Stanley, the growth trajectory is expected to continue and can reach up to 8% in the next 5 years.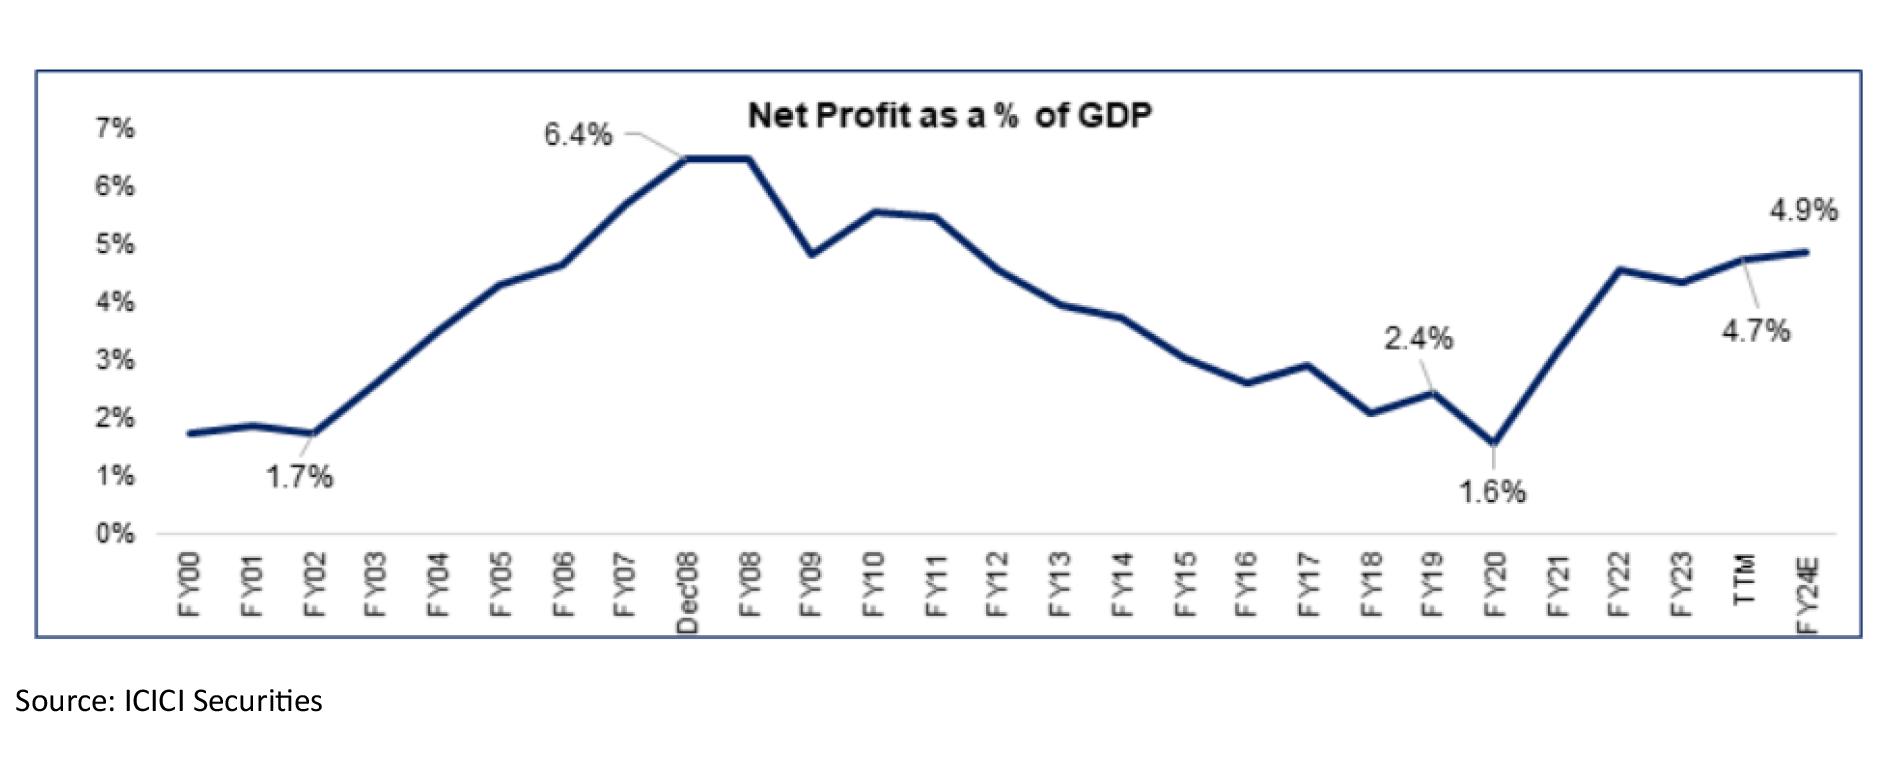
-
Unlevered Corporate India provides huge elbow room for growth
The Indian economy has undergone a significant structural transformation since 2017, resulting in enhanced company profitability, robust banks and corporate balance sheets. This profitability surge coincides with a period where Debt/Equity ratios have hit a 15-year low: This favourable scenario presents an opportune moment for companies to leverage their strengthened financial positions and embark on expansion initiatives. As companies capitalize on this improved leverage capacity, it is expected to catalyse private capital expenditure (capex) activities, thereby further stimulating economic growth and development.
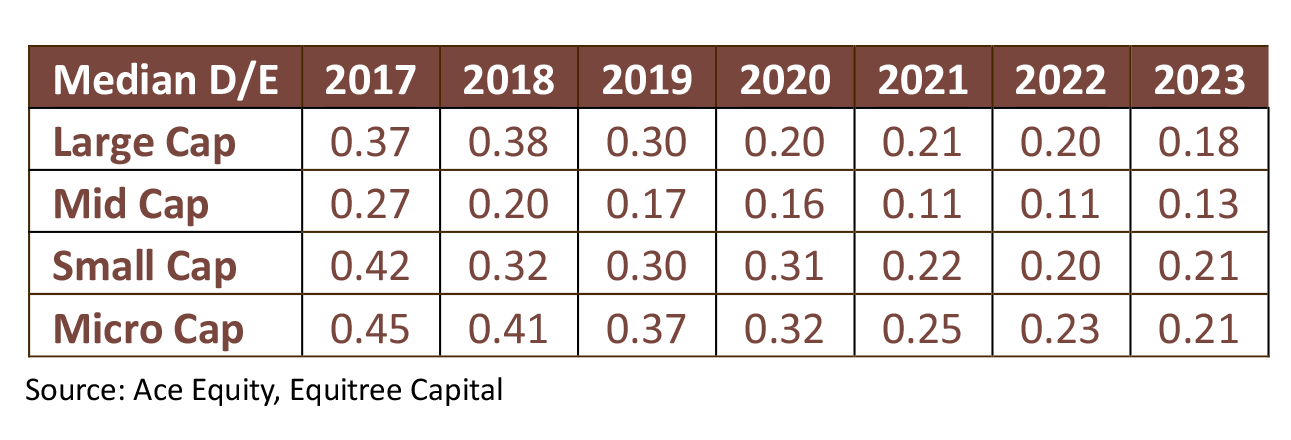
-
Capital expenditure at an all-time high:
-
Risks to monitor
While all stars look aligned for a super earnings growth trajectory, one needs to be watchful for risks that may hit the juggernaut:
- Any change in political leadership – needless to say that the current political leadership has played a crucial role in various policy decisions which has put India on the global stage as a leading economy. Should there be any change in the political leadership it may bring about bouts of anxiety in terms of continuation of policies and focus areas, amongst other things. This may clearly impact the expected growth.
- Any regulatory clampdown to arrest the “froth” that the SEBI chairman spoke about – we saw this happening in 2018 as well! To cool off the markets regulator tends to come up with restrictive practices which may impact the sentiments / liquidity. Should there be any such effort on the regulators part, that may jeopardise the market.
- Any black swan events such as unexpected geopolitical issues which may flare up etc.
“Individual stocks may obviously pursue courses widely dissimilar” – Philip Carret
Broader Headline Nos. Distorts the Story – Going Granular has to be the Theme
We think that this entire conversation about valuations getting heated at the index level is a bit stretched for a couple of reasons from our perspective:
- The NSE Small Cap index itself has an average market cap of Rs. 22000cr which is not “small” for us. Our focus average market cap is about Rs. 1500-2000cr, which is substantially lower and doesn’t have any meaningful representation in the Small Cap index.
- Even if one were to look at Micro Cap indices, the weightages of a few companies tend to distort the overall valuation nos. Interestingly, if one were to look at the broad base of companies in the market cap range of Rs. 200-5000cr, these are still pretty much trading at their 10 years averages – which is very reasonable from our perspective.
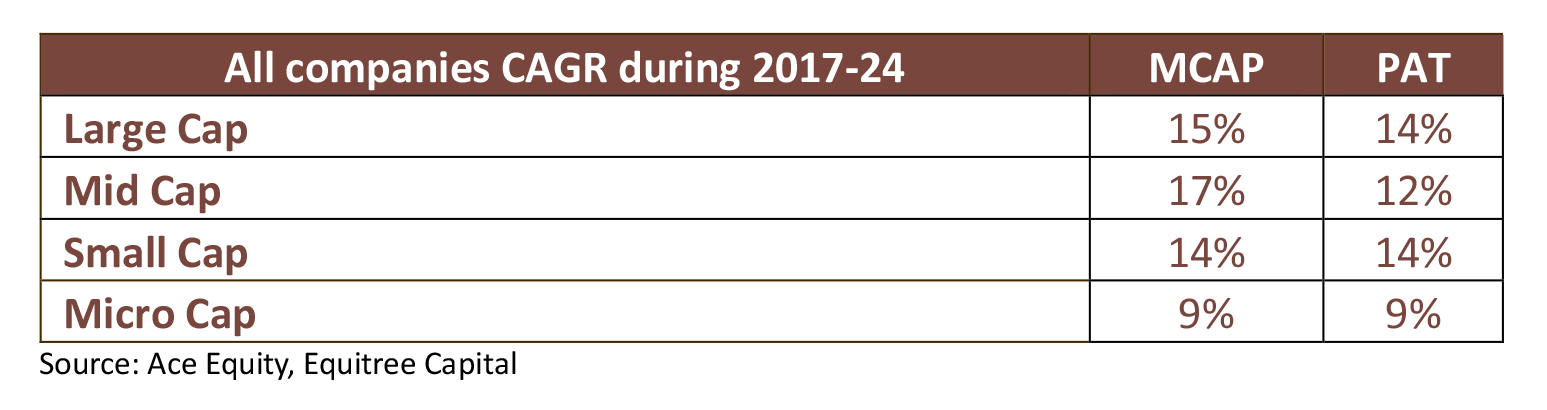
To validate our point, we analysed data on market cap and profit growth – which would eventually lead in to valuations, by classifying companies as: Large Cap (1-100 companies), Mid Cap (101- 150th), Small Cap (151st up to 5000 Cr) and Microcap (200 Cr – 5000 Cr).
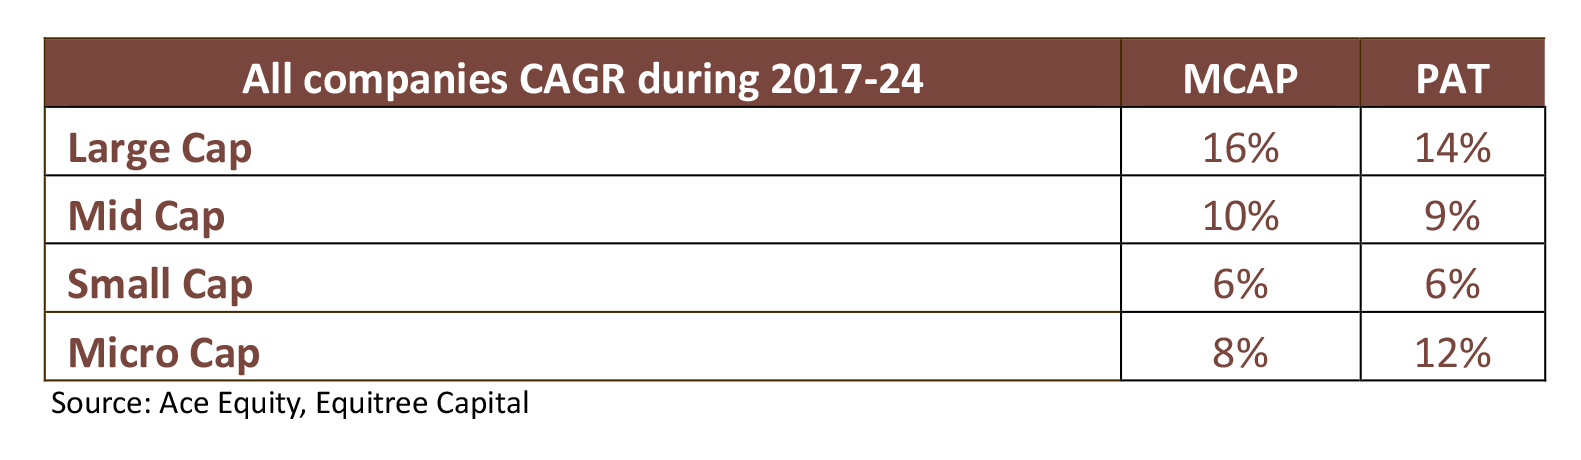
At a macro level, this is how the CAGR growth of market cap and profits look like from FY2017-24:
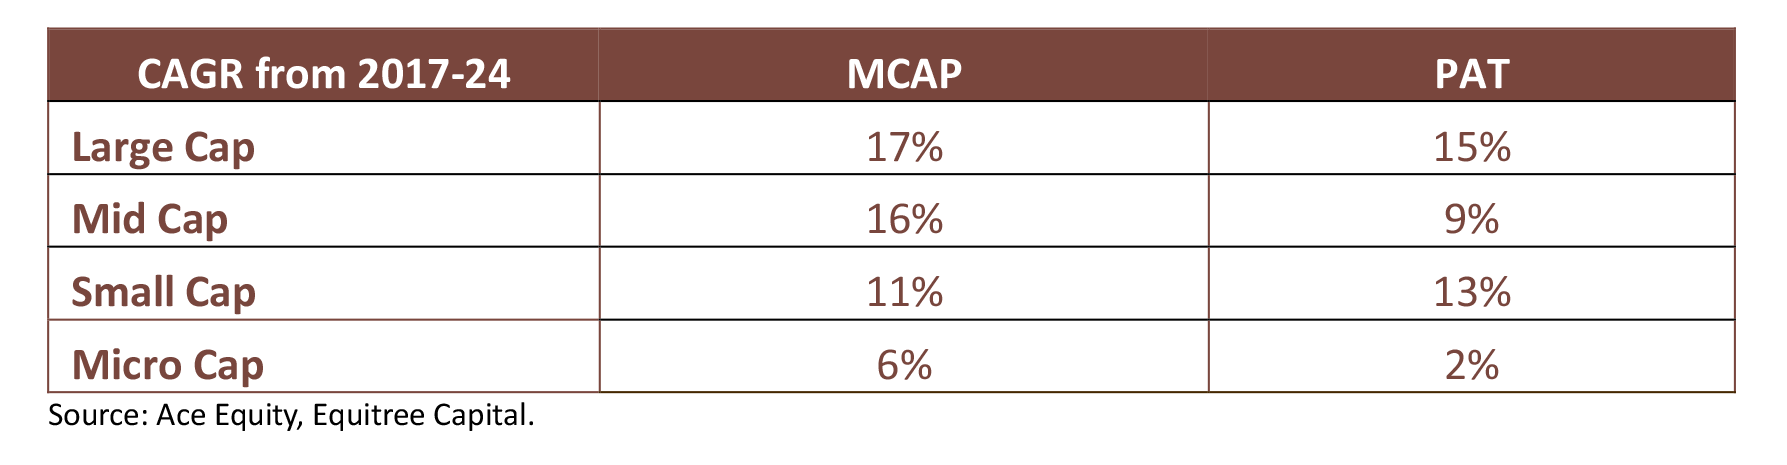
However, as one gets granular in to this macro picture, the data presents a completely different story:
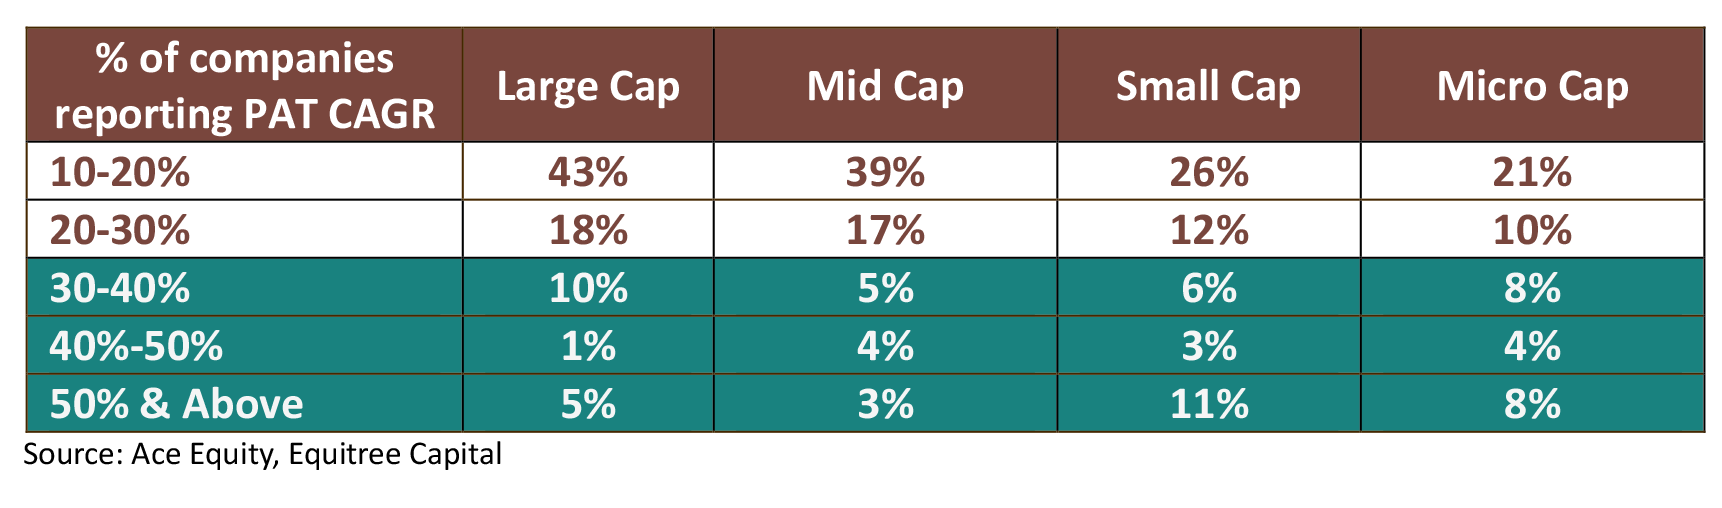
Interestingly:
- When we look at the overall microcap segment, it shows a PAT growth of 2%, whereas more than half of these companies have posted PAT growth of more than 10%.
- A substantial 20% of the companies from each segment has achieved PAT growth of more than 30%!
We further sliced this down within our focus sectors to further validate and the same story echoes everywhere:
-
Manufacturing Segment:
- Median PE of microcap segment is in similar line with the 2017 level as Mcap and PAT of microcap companies in this segment has grown at 9% CAGR.
- Within the manufacturing segment, 42% of companies have witnessed a doubling of their Profit After Tax (PAT) over the past six years.
- 20% of the companies have posted more than 30% PAT CAGR in the microcap segment in the manufacturing segment.
-
Consumer Segment:
- Over the course of the last six years, the aggregate profits of this segment have doubled and the median price-to-earnings (PE) ratio of the microcap segment aligns closely with 2017 levels, indicating a sustained level of valuation stability.
- Within the consumer segment, 46% of companies have witnessed a doubling of their Profit After Tax (PAT) over the past six years.
- 22% of the companies have posted more than 30% PAT CAGR in the microcap segment.
-
Infra Segment:
- Large write offs / negative performances of a few companies in the pack distorts the picture for the entire pack with negative growth during FY17-24.
- However, one of our own companies in the Infra segment has seen its profits increasing over 3x during this period!
- Likewise there a quite a few of such companies which have done well despite the overall pack showing negative numbers.
We have always believed in ground up stock picking rather than getting carried away by the headline nos as there always would be outliers in the pack – these outliers are the ones where substantial value creation actually happens!
In hindsight, the Micro Cap segment on an overall basis looks pale in terms of growth etc almost making the pack itself un-investible. However, if one were to think of it, about 20% of the companies across each of our focus segment have reported CAGR growth of over 30%+ over the last six years. Only if one were focused enough to plough in to this segment and would have invested in some of these top quality businesses, the alpha generation would have been substantially different.
This is exactly what we did at Equitree to deliver CAGR returns of 55.53% over the last 4 years!
“The daily blips of the market are, in fact, noise – noise that is very difficult for most investors to tune out” – Seth Klarman
Outlook for FY25:
After a fast paced rise in the markets during Apr-Dec’24, we were expecting the markets to see some profit booking and were budgeting for 3-5% correction in the index and about 20-25% drawdown in the small caps.
We indeed get a brief the correction with over 75% of the companies seeing a drop by more than 10%, 60% by more than 15%, 43% by over 20%, and 28% by more than 25% from their respective 52-week highs during the past couple of months. However, the markets have seen an equally quick and swift recovery again in April’24 earning back a lot of this correction already.
We had expected some time correction as well for stocks to get consolidated, which is not happened in this case. This gives us a feel that we may still experience another round of absolute / time correction being played out in the 1st half of FY25 as election results are done with, various geo political and other global issues roll out. However, we believe that earnings buoyancy and liquidity should take over in the 2nd half of FY25 and lay the foundation for another bull run over the next couple of years.
Overall, we believe FY25 will be a year of ground up stock picking for alpha generation with the broader markets giving high single digit or lower teens kind of return. One could also see profit booking happening in certain segments where valuations have built in high order books while challenges of execution gets experienced in FY25. We believe this sector rotation should see money chasing businesses with growth visibility and still trading at reasonable valuation – that’s again where ‘bottomup stock picking’ will come about again.
In this light we remain supremely confident of our portfolio companies as they unfold another year of high growth. We expect profits of our portfolio companies to growth at about 24% in FY25. Given that the portfolio still trades at a mere 16x FY25 PAT, we strongly believe that we should continue to see significant wealth creation happening on our portfolio.
We again reiterate, any potential correction in the market should be leveraged by investors to build up on the portfolio as we enter a multi year growth story which eventually should lead to significant value creation happening over the next couple of years.
Please feel free to reach out to us at pawan.b@equitreecapital.com / skabra@equitreecapital.com with your comments / suggestions/ feedback etc.
Please follow our LinkedIn for regular updates on our performance and market insights!
Warm regards.
TEAM EQUITREE